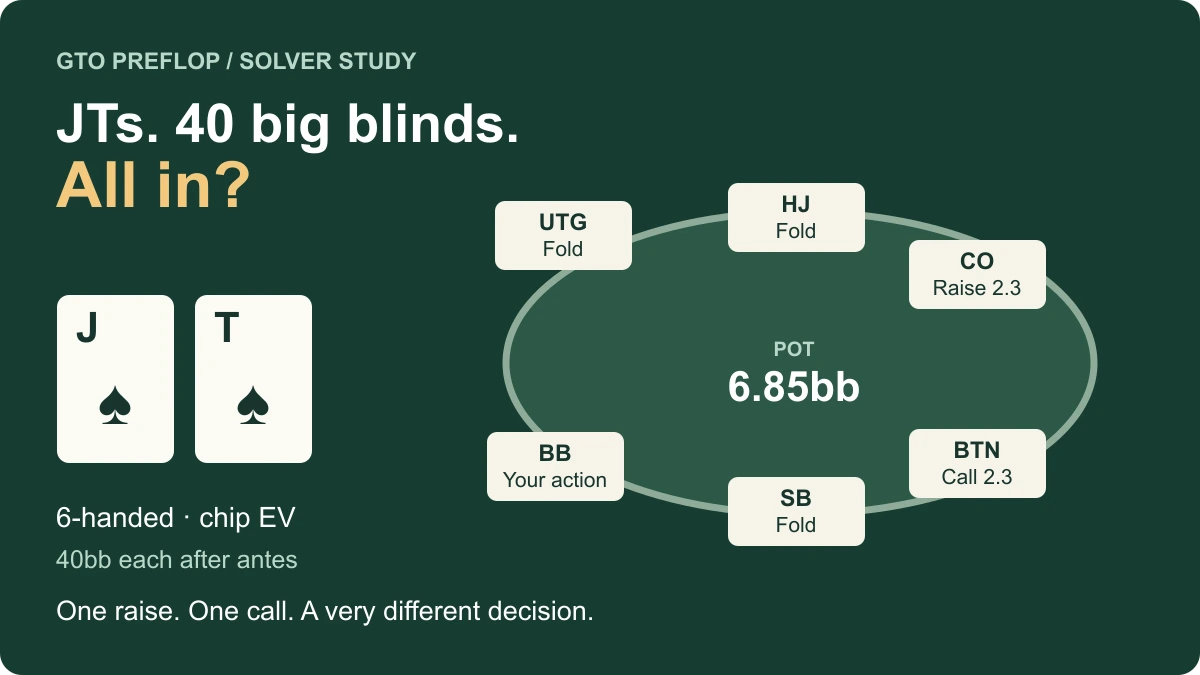
The cutoff raises. The button calls. You look down at J♠ T♠ in the big blind with 40bb.
Calling looks comfortable. Moving all in looks enormous. In the six-handed chip-EV solve we checked, JTs shoves 99.6% of the time.
That supports a useful idea: after a late-position open and a call, JTs can be a serious squeeze-jam candidate at 30–40bb. The trouble starts when you remember the hand and stack size but forget who entered the pot. Against an UTG raise and an UTG+1 call in our eight-handed 40bb solve, JTs never shoves. It calls.
We tested 60 configured spots to find that boundary. These are stored solver outputs, checked on September 7, 2026. The explanations below are our attempt to understand the results; they are not proof that we know why every frequency appears.
Start with the actual 40bb decision
The main example is six-handed no-limit hold’em, measured in chip EV: chips are valued directly, with no payout or bounty model. Each player has 40bb available for betting after posting a 0.125bb ante. There is no rake.
UTG and HJ fold, CO raises to 2.3bb, BTN calls, and SB folds. The pot is 6.85bb: two 2.3bb contributions, the 0.5bb and 1bb blinds, and 0.75bb in antes. JTs means all four suited jack-ten combinations; J♠ T♠ is our illustration.
The big blind can fold, call, raise to 10.7bb, or shove to 40bb. These are the sizes in this tree, not every possible squeeze size.
| Action | Frequency | EV (bb) |
|---|---|---|
| Fold | 0.00% | +0.000 |
| Call | 0.01% | +0.995 |
| Raise to 10.7bb | 0.39% | +1.157 |
| Shove to 40bb | 99.60% | +1.240 |
EV is in big blinds from this decision, with folding set to zero. Shoving leads calling by 0.245bb and the smaller squeeze by 0.082bb, using the reported values. Differences are calculated before rounding. These compare actions against the stored continuations. The export does not report achieved solver precision, so small gaps deserve caution; the method notes explain the limits.
The small blind also shoves JTs almost every time in this formation: 99.67%. Its tree includes a 9.2bb squeeze, and the big blind is still behind it. That result comes from a separate SB decision; it is not copied from the BB chart.
The stack-and-position test
We checked five available depths: 20, 25, 30, 40 and 50bb, at six- and eight-handed tables. At each depth we tested three opening/calling formations from both blinds. That makes 60 configured decisions, with equal stacks and the same per-player ante.
“UTG → HJ” below means UTG opens and HJ calls. Every other player who acts before hero folds. When hero is SB, BB remains to act. In the eight-handed early-position test, the caller is UTG+1 instead.
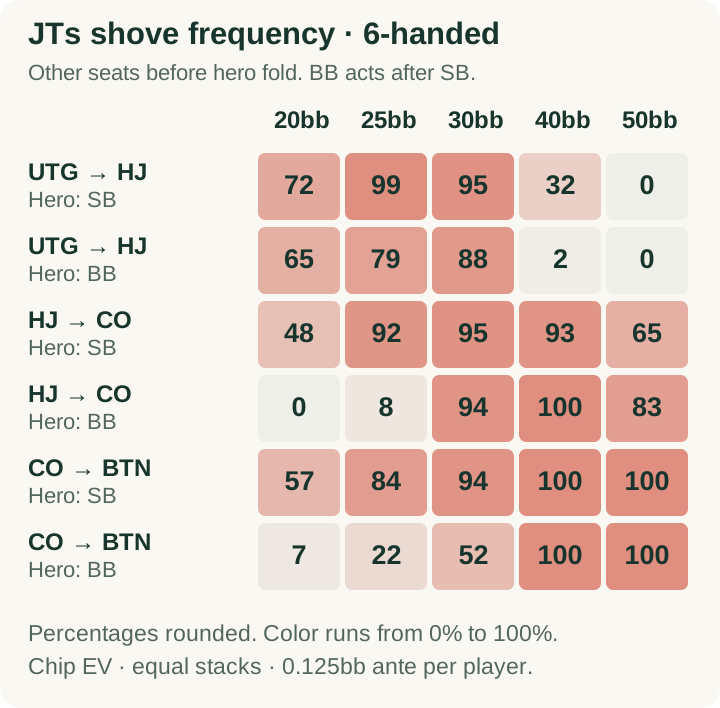
Exact 6-handed frequencies and the cost of shoving
| Stack (bb) | Open → call | Hero | JTs shoves | Loss vs best EV (bb) |
|---|---|---|---|---|
| 20 | UTG→HJ | SB | 71.77% | 0.000 |
| 20 | UTG→HJ | BB | 65.18% | 0.000 |
| 20 | HJ→CO | SB | 48.34% | 0.000 |
| 20 | HJ→CO | BB | 0.01% | 0.058 |
| 20 | CO→BTN | SB | 57.45% | 0.002 |
| 20 | CO→BTN | BB | 6.94% | 0.030 |
| 25 | UTG→HJ | SB | 99.18% | 0.000 |
| 25 | UTG→HJ | BB | 79.16% | 0.000 |
| 25 | HJ→CO | SB | 92.03% | 0.000 |
| 25 | HJ→CO | BB | 8.45% | 0.066 |
| 25 | CO→BTN | SB | 84.14% | 0.000 |
| 25 | CO→BTN | BB | 22.01% | 0.012 |
| 30 | UTG→HJ | SB | 94.76% | 0.000 |
| 30 | UTG→HJ | BB | 88.26% | 0.000 |
| 30 | HJ→CO | SB | 94.76% | 0.000 |
| 30 | HJ→CO | BB | 93.70% | 0.000 |
| 30 | CO→BTN | SB | 93.87% | 0.000 |
| 30 | CO→BTN | BB | 51.63% | 0.000 |
| 40 | UTG→HJ | SB | 32.28% | 0.034 |
| 40 | UTG→HJ | BB | 2.43% | 0.079 |
| 40 | HJ→CO | SB | 93.17% | 0.000 |
| 40 | HJ→CO | BB | 99.67% | 0.000 |
| 40 | CO→BTN | SB | 99.67% | 0.000 |
| 40 | CO→BTN | BB | 99.60% | 0.000 |
| 50 | UTG→HJ | SB | 0.00% | 0.277 |
| 50 | UTG→HJ | BB | 0.00% | 0.287 |
| 50 | HJ→CO | SB | 65.49% | 0.000 |
| 50 | HJ→CO | BB | 83.45% | 0.000 |
| 50 | CO→BTN | SB | 99.84% | 0.000 |
| 50 | CO→BTN | BB | 99.95% | 0.000 |
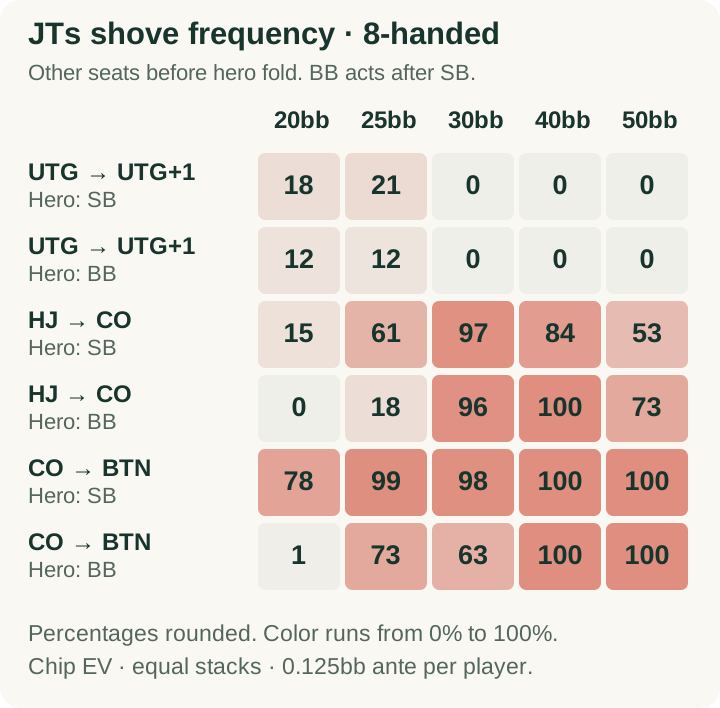
Exact 8-handed frequencies and the cost of shoving
| Stack (bb) | Open → call | Hero | JTs shoves | Loss vs best EV (bb) |
|---|---|---|---|---|
| 20 | UTG→UTG+1 | SB | 18.03% | 0.009 |
| 20 | UTG→UTG+1 | BB | 12.14% | 0.070 |
| 20 | HJ→CO | SB | 14.53% | 0.020 |
| 20 | HJ→CO | BB | 0.00% | 0.184 |
| 20 | CO→BTN | SB | 77.99% | 0.001 |
| 20 | CO→BTN | BB | 0.66% | 0.018 |
| 25 | UTG→UTG+1 | SB | 20.97% | 0.001 |
| 25 | UTG→UTG+1 | BB | 11.62% | 0.056 |
| 25 | HJ→CO | SB | 61.07% | 0.000 |
| 25 | HJ→CO | BB | 17.81% | 0.015 |
| 25 | CO→BTN | SB | 99.44% | 0.000 |
| 25 | CO→BTN | BB | 72.65% | 0.000 |
| 30 | UTG→UTG+1 | SB | 0.00% | 0.159 |
| 30 | UTG→UTG+1 | BB | 0.01% | 0.168 |
| 30 | HJ→CO | SB | 96.85% | 0.000 |
| 30 | HJ→CO | BB | 96.41% | 0.000 |
| 30 | CO→BTN | SB | 97.85% | 0.000 |
| 30 | CO→BTN | BB | 63.41% | 0.000 |
| 40 | UTG→UTG+1 | SB | 0.00% | 0.840 |
| 40 | UTG→UTG+1 | BB | 0.00% | 0.749 |
| 40 | HJ→CO | SB | 84.14% | 0.000 |
| 40 | HJ→CO | BB | 99.85% | 0.000 |
| 40 | CO→BTN | SB | 100.00% | 0.000 |
| 40 | CO→BTN | BB | 99.99% | 0.000 |
| 50 | UTG→UTG+1 | SB | 0.00% | 2.146 |
| 50 | UTG→UTG+1 | BB | 0.00% | 1.936 |
| 50 | HJ→CO | SB | 53.16% | 0.004 |
| 50 | HJ→CO | BB | 72.61% | 0.000 |
| 50 | CO→BTN | SB | 99.98% | 0.000 |
| 50 | CO→BTN | BB | 99.97% | 0.000 |
At 30bb and 40bb, shoving has the highest reported JTs EV in all 16 HJ→CO and CO→BTN cases across the two table sizes and both blinds. Its frequency ranges from 51.63% to 100%. The result supports considering the shove in those formations; it does not turn every cell into a pure-shove instruction.
Shorter also does not automatically mean more shoving. At six-handed CO→BTN nodes, the BB’s JTs shove frequency rises from 6.94% at 20bb to 51.63% at 30bb and 99.60% at 40bb. The opening size changes from 2bb to 2.1bb to 2.3bb, and the ranges change with depth. This is a comparison of complete available configurations, not an isolated experiment on stack size.
The caller changes more than the pot
Now remove the button’s call. Keep the six-handed 40bb configuration and CO’s 2.3bb open; everyone else folds to the BB.
JTs calls 99.93% and shoves 0.01%. Put the caller back, and the shove jumps to 99.6%.
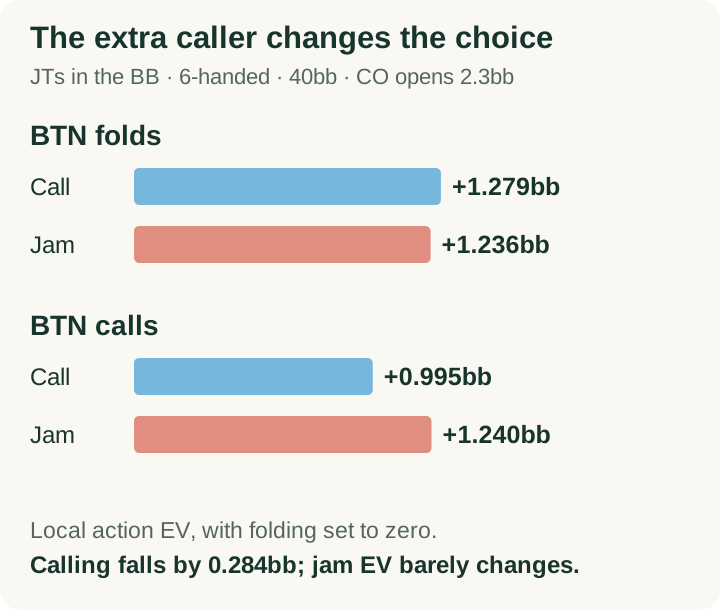
| BTN action | Call EV (bb) | Shove EV (bb) |
|---|---|---|
| Folds | +1.279 | +1.236 |
| Calls | +0.995 | +1.240 |
The reported shove EV barely moves. Calling falls by 0.284bb. So “there is more dead money to win” tells only part of this particular story.
A plausible explanation is that JTs gives up some of the value of a cheap heads-up call when another range enters the pot. Shoving takes its equity to showdown if called, while avoiding later betting decisions. But this comparison also changes the ranges, possible responses, and smaller raise size. It does not isolate one cause.
Andrew Brokos discusses the related attraction of large squeeze-jams with hands that dislike raising and then folding. Our comparison gives a more specific study cue: check how good calling remains before deciding that a hand “must” be a shove.
Why JTs, when QJs mostly calls?
A stronger-looking hand need not prefer the more aggressive action.
| Hand | Call | Raise 10.7bb | Shove | Call EV (bb) | Shove EV (bb) |
|---|---|---|---|---|---|
| JTs | 0.01% | 0.39% | 99.60% | +0.995 | +1.240 |
| QJs | 95.05% | 2.74% | 2.21% | +1.257 | +1.077 |
| T9s | 1.92% | 0.00% | 98.08% | +0.734 | +0.869 |
| A5s | 100.00% | 0.00% | 0.00% | +1.006 | +0.881 |
| 88 | 0.00% | 20.75% | 79.25% | +2.162 | +3.912 |
| AKo | 0.00% | 14.77% | 85.23% | +2.988 | +7.705 |
On a narrow screen, scroll the table sideways to see the EV columns.
QJs has a more valuable call than JTs: 1.257bb versus 0.995bb. Its shove is worth less: 1.077bb versus 1.240bb. That reverses the preferred action. These values support looking at the alternatives for each hand; they do not establish a single blocker or equity explanation for the QJs/JTs difference.
A5s also calls throughout this node. Having an ace blocker does not settle the squeeze decision.
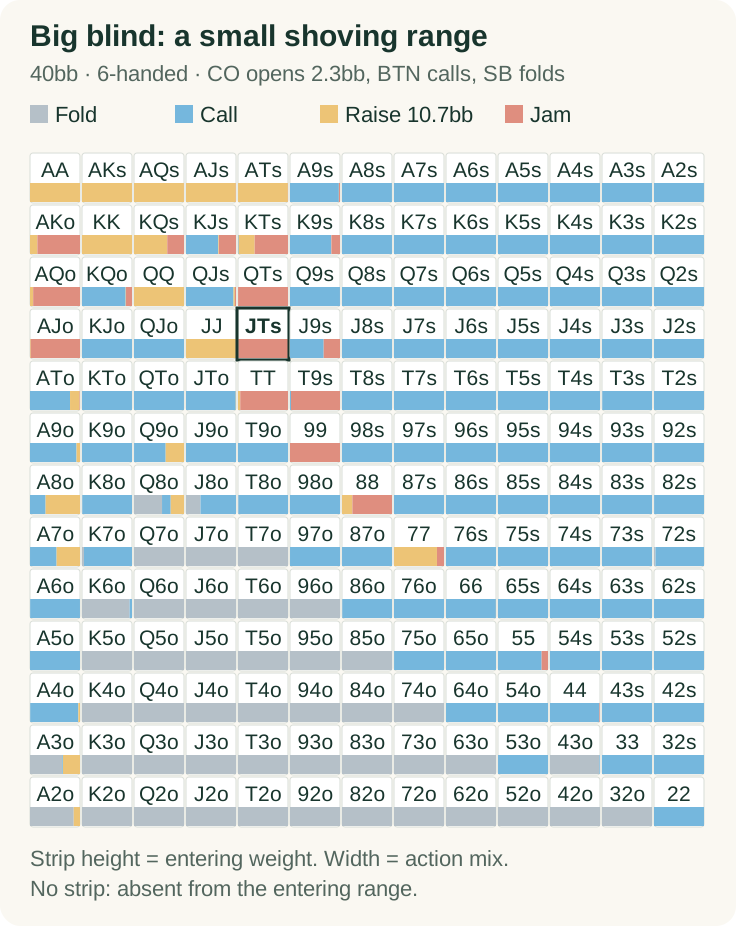
Across the whole BB range, the displayed combination-weighted shares are 39.27% fold, 48.91% call, 6.35% smaller raise, and 5.47% shove. JTs belongs to a fairly small shoving group. These are shares of the 1,326 starting combinations before conditioning on opponents’ private cards, not the rate at which shoves occur in dealt hands.
Exact range values and downloadable figure data
Entering weight is the frequency with which this hand follows its player’s earlier action. Action percentages are conditional on reaching this decision. Hands with zero entering weight are omitted here and have no strip in the figure.
| Hand | Entering weight | Fold | Call | Raise 10.7bb | Jam |
|---|---|---|---|---|---|
| AA | 100.00% | 0.00% | 0.00% | 100.00% | 0.00% |
| AKs | 100.00% | 0.00% | 0.00% | 99.94% | 0.06% |
| AQs | 100.00% | 0.00% | 0.00% | 99.85% | 0.15% |
| AJs | 100.00% | 0.00% | 0.00% | 99.66% | 0.34% |
| ATs | 100.00% | 0.00% | 0.06% | 99.67% | 0.27% |
| A9s | 100.00% | 0.00% | 97.75% | 0.18% | 2.07% |
| A8s | 100.00% | 0.00% | 99.91% | 0.08% | 0.01% |
| A7s | 100.00% | 0.00% | 100.00% | 0.00% | 0.00% |
| A6s | 100.00% | 0.00% | 100.00% | 0.00% | 0.00% |
| A5s | 100.00% | 0.00% | 100.00% | 0.00% | 0.00% |
| A4s | 100.00% | 0.00% | 100.00% | 0.00% | 0.00% |
| A3s | 100.00% | 0.00% | 100.00% | 0.00% | 0.00% |
| A2s | 100.00% | 0.00% | 99.98% | 0.00% | 0.02% |
| AKo | 100.00% | 0.00% | 0.00% | 14.77% | 85.23% |
| KK | 100.00% | 0.00% | 0.00% | 100.00% | 0.00% |
| KQs | 100.00% | 0.00% | 0.00% | 66.52% | 33.48% |
| KJs | 100.00% | 0.00% | 64.51% | 1.28% | 34.21% |
| KTs | 100.00% | 0.00% | 1.33% | 32.00% | 66.67% |
| K9s | 100.00% | 0.00% | 82.48% | 0.30% | 17.22% |
| K8s | 100.00% | 0.00% | 99.98% | 0.01% | 0.01% |
| K7s | 100.00% | 0.00% | 100.00% | 0.00% | 0.00% |
| K6s | 100.00% | 0.00% | 100.00% | 0.00% | 0.00% |
| K5s | 100.00% | 0.00% | 100.00% | 0.00% | 0.00% |
| K4s | 100.00% | 0.00% | 100.00% | 0.00% | 0.00% |
| K3s | 100.00% | 0.00% | 100.00% | 0.00% | 0.00% |
| K2s | 100.00% | 0.00% | 100.00% | 0.00% | 0.00% |
| AQo | 100.00% | 0.00% | 0.00% | 6.34% | 93.66% |
| KQo | 100.00% | 0.00% | 87.34% | 0.69% | 11.97% |
| 100.00% | 0.00% | 0.00% | 99.99% | 0.01% | |
| QJs | 100.00% | 0.00% | 95.05% | 2.74% | 2.21% |
| QTs | 100.00% | 0.00% | 0.12% | 0.06% | 99.82% |
| Q9s | 100.00% | 0.00% | 99.95% | 0.02% | 0.03% |
| Q8s | 100.00% | 0.00% | 99.99% | 0.00% | 0.01% |
| Q7s | 100.00% | 0.00% | 99.99% | 0.01% | 0.00% |
| Q6s | 100.00% | 0.00% | 100.00% | 0.00% | 0.00% |
| Q5s | 100.00% | 0.00% | 100.00% | 0.00% | 0.00% |
| Q4s | 100.00% | 0.00% | 100.00% | 0.00% | 0.00% |
| Q3s | 100.00% | 0.01% | 99.99% | 0.00% | 0.00% |
| Q2s | 100.00% | 0.00% | 100.00% | 0.00% | 0.00% |
| AJo | 100.00% | 0.00% | 0.00% | 1.43% | 98.57% |
| KJo | 100.00% | 0.00% | 100.00% | 0.00% | 0.00% |
| QJo | 100.00% | 0.00% | 100.00% | 0.00% | 0.00% |
| JJ | 100.00% | 0.00% | 0.00% | 99.89% | 0.11% |
| JTs | 100.00% | 0.00% | 0.01% | 0.39% | 99.60% |
| J9s | 100.00% | 0.00% | 67.37% | 0.01% | 32.62% |
| J8s | 100.00% | 0.00% | 100.00% | 0.00% | 0.00% |
| J7s | 100.00% | 0.00% | 100.00% | 0.00% | 0.00% |
| J6s | 100.00% | 0.00% | 100.00% | 0.00% | 0.00% |
| J5s | 100.00% | 0.00% | 100.00% | 0.00% | 0.00% |
| J4s | 100.00% | 0.01% | 99.99% | 0.00% | 0.00% |
| J3s | 100.00% | 0.00% | 100.00% | 0.00% | 0.00% |
| J2s | 100.00% | 0.02% | 99.98% | 0.00% | 0.00% |
| ATo | 100.00% | 0.00% | 80.07% | 19.03% | 0.90% |
| KTo | 100.00% | 0.00% | 99.98% | 0.01% | 0.01% |
| QTo | 100.00% | 0.00% | 99.96% | 0.04% | 0.00% |
| JTo | 100.00% | 0.00% | 99.51% | 0.49% | 0.00% |
| TT | 100.00% | 0.00% | 0.00% | 4.51% | 95.49% |
| T9s | 100.00% | 0.00% | 1.92% | 0.00% | 98.08% |
| T8s | 100.00% | 0.00% | 100.00% | 0.00% | 0.00% |
| T7s | 100.00% | 0.00% | 100.00% | 0.00% | 0.00% |
| T6s | 100.00% | 0.00% | 100.00% | 0.00% | 0.00% |
| T5s | 100.00% | 0.00% | 100.00% | 0.00% | 0.00% |
| T4s | 100.00% | 0.00% | 100.00% | 0.00% | 0.00% |
| T3s | 100.00% | 0.57% | 99.43% | 0.00% | 0.00% |
| T2s | 100.00% | 0.04% | 99.96% | 0.00% | 0.00% |
| A9o | 100.00% | 0.00% | 93.05% | 6.95% | 0.00% |
| K9o | 100.00% | 0.00% | 100.00% | 0.00% | 0.00% |
| Q9o | 100.00% | 0.10% | 63.25% | 36.65% | 0.00% |
| J9o | 100.00% | 0.01% | 99.99% | 0.00% | 0.00% |
| T9o | 100.00% | 0.01% | 99.99% | 0.00% | 0.00% |
| 99 | 100.00% | 0.00% | 0.00% | 0.01% | 99.99% |
| 98s | 100.00% | 0.00% | 100.00% | 0.00% | 0.00% |
| 97s | 100.00% | 0.00% | 100.00% | 0.00% | 0.00% |
| 96s | 100.00% | 0.00% | 100.00% | 0.00% | 0.00% |
| 95s | 100.00% | 0.01% | 99.99% | 0.00% | 0.00% |
| 94s | 100.00% | 0.02% | 99.98% | 0.00% | 0.00% |
| 93s | 100.00% | 0.03% | 99.97% | 0.00% | 0.00% |
| 92s | 100.00% | 0.43% | 99.57% | 0.00% | 0.00% |
| A8o | 100.00% | 0.00% | 31.22% | 68.78% | 0.00% |
| K8o | 100.00% | 0.56% | 99.44% | 0.00% | 0.00% |
| Q8o | 100.00% | 56.07% | 17.33% | 26.60% | 0.00% |
| J8o | 100.00% | 29.03% | 70.97% | 0.00% | 0.00% |
| T8o | 100.00% | 0.70% | 99.30% | 0.00% | 0.00% |
| 98o | 100.00% | 0.00% | 100.00% | 0.00% | 0.00% |
| 88 | 100.00% | 0.00% | 0.00% | 20.75% | 79.25% |
| 87s | 100.00% | 0.00% | 100.00% | 0.00% | 0.00% |
| 86s | 100.00% | 0.00% | 100.00% | 0.00% | 0.00% |
| 85s | 100.00% | 0.00% | 100.00% | 0.00% | 0.00% |
| 84s | 100.00% | 0.01% | 99.99% | 0.00% | 0.00% |
| 83s | 100.00% | 0.09% | 99.91% | 0.00% | 0.00% |
| 82s | 100.00% | 0.24% | 99.76% | 0.00% | 0.00% |
| A7o | 100.00% | 0.07% | 53.15% | 46.78% | 0.00% |
| K7o | 100.00% | 3.94% | 96.06% | 0.00% | 0.00% |
| Q7o | 100.00% | 100.00% | 0.00% | 0.00% | 0.00% |
| J7o | 100.00% | 100.00% | 0.00% | 0.00% | 0.00% |
| T7o | 100.00% | 100.00% | 0.00% | 0.00% | 0.00% |
| 97o | 100.00% | 0.03% | 99.97% | 0.00% | 0.00% |
| 87o | 100.00% | 0.04% | 99.96% | 0.00% | 0.00% |
| 77 | 100.00% | 0.00% | 0.01% | 85.92% | 14.07% |
| 76s | 100.00% | 0.00% | 100.00% | 0.00% | 0.00% |
| 75s | 100.00% | 0.00% | 100.00% | 0.00% | 0.00% |
| 74s | 100.00% | 0.00% | 100.00% | 0.00% | 0.00% |
| 73s | 100.00% | 0.01% | 99.99% | 0.00% | 0.00% |
| 72s | 100.00% | 2.99% | 97.01% | 0.00% | 0.00% |
| A6o | 100.00% | 0.34% | 99.63% | 0.03% | 0.00% |
| K6o | 100.00% | 95.17% | 4.83% | 0.00% | 0.00% |
| Q6o | 100.00% | 100.00% | 0.00% | 0.00% | 0.00% |
| J6o | 100.00% | 100.00% | 0.00% | 0.00% | 0.00% |
| T6o | 100.00% | 100.00% | 0.00% | 0.00% | 0.00% |
| 96o | 100.00% | 100.00% | 0.00% | 0.00% | 0.00% |
| 86o | 100.00% | 0.53% | 99.47% | 0.00% | 0.00% |
| 76o | 100.00% | 0.00% | 100.00% | 0.00% | 0.00% |
| 66 | 100.00% | 0.00% | 99.81% | 0.11% | 0.08% |
| 65s | 100.00% | 0.00% | 100.00% | 0.00% | 0.00% |
| 64s | 100.00% | 0.00% | 100.00% | 0.00% | 0.00% |
| 63s | 100.00% | 0.00% | 100.00% | 0.00% | 0.00% |
| 62s | 100.00% | 0.04% | 99.96% | 0.00% | 0.00% |
| A5o | 100.00% | 0.02% | 99.97% | 0.01% | 0.00% |
| K5o | 100.00% | 100.00% | 0.00% | 0.00% | 0.00% |
| Q5o | 100.00% | 100.00% | 0.00% | 0.00% | 0.00% |
| J5o | 100.00% | 100.00% | 0.00% | 0.00% | 0.00% |
| T5o | 100.00% | 100.00% | 0.00% | 0.00% | 0.00% |
| 95o | 100.00% | 100.00% | 0.00% | 0.00% | 0.00% |
| 85o | 100.00% | 100.00% | 0.00% | 0.00% | 0.00% |
| 75o | 100.00% | 0.15% | 99.85% | 0.00% | 0.00% |
| 65o | 100.00% | 0.00% | 100.00% | 0.00% | 0.00% |
| 55 | 100.00% | 0.00% | 87.21% | 0.00% | 12.79% |
| 54s | 100.00% | 0.00% | 100.00% | 0.00% | 0.00% |
| 53s | 100.00% | 0.00% | 100.00% | 0.00% | 0.00% |
| 52s | 100.00% | 0.01% | 99.99% | 0.00% | 0.00% |
| A4o | 100.00% | 0.44% | 96.26% | 3.30% | 0.00% |
| K4o | 100.00% | 99.99% | 0.01% | 0.00% | 0.00% |
| Q4o | 100.00% | 100.00% | 0.00% | 0.00% | 0.00% |
| J4o | 100.00% | 100.00% | 0.00% | 0.00% | 0.00% |
| T4o | 100.00% | 100.00% | 0.00% | 0.00% | 0.00% |
| 94o | 100.00% | 100.00% | 0.00% | 0.00% | 0.00% |
| 84o | 100.00% | 100.00% | 0.00% | 0.00% | 0.00% |
| 74o | 100.00% | 100.00% | 0.00% | 0.00% | 0.00% |
| 64o | 100.00% | 0.02% | 99.98% | 0.00% | 0.00% |
| 54o | 100.00% | 0.00% | 100.00% | 0.00% | 0.00% |
| 44 | 100.00% | 0.00% | 98.80% | 0.00% | 1.20% |
| 43s | 100.00% | 0.00% | 100.00% | 0.00% | 0.00% |
| 42s | 100.00% | 0.00% | 100.00% | 0.00% | 0.00% |
| A3o | 100.00% | 64.40% | 1.50% | 34.10% | 0.00% |
| K3o | 100.00% | 100.00% | 0.00% | 0.00% | 0.00% |
| Q3o | 100.00% | 100.00% | 0.00% | 0.00% | 0.00% |
| J3o | 100.00% | 100.00% | 0.00% | 0.00% | 0.00% |
| T3o | 100.00% | 100.00% | 0.00% | 0.00% | 0.00% |
| 93o | 100.00% | 100.00% | 0.00% | 0.00% | 0.00% |
| 83o | 100.00% | 100.00% | 0.00% | 0.00% | 0.00% |
| 73o | 100.00% | 100.00% | 0.00% | 0.00% | 0.00% |
| 63o | 100.00% | 100.00% | 0.00% | 0.00% | 0.00% |
| 53o | 100.00% | 0.05% | 99.95% | 0.00% | 0.00% |
| 43o | 100.00% | 98.74% | 1.26% | 0.00% | 0.00% |
| 33 | 100.00% | 0.00% | 100.00% | 0.00% | 0.00% |
| 32s | 100.00% | 0.01% | 99.99% | 0.00% | 0.00% |
| A2o | 100.00% | 87.46% | 0.01% | 12.53% | 0.00% |
| K2o | 100.00% | 100.00% | 0.00% | 0.00% | 0.00% |
| Q2o | 100.00% | 100.00% | 0.00% | 0.00% | 0.00% |
| J2o | 100.00% | 100.00% | 0.00% | 0.00% | 0.00% |
| T2o | 100.00% | 100.00% | 0.00% | 0.00% | 0.00% |
| 92o | 100.00% | 100.00% | 0.00% | 0.00% | 0.00% |
| 82o | 100.00% | 100.00% | 0.00% | 0.00% | 0.00% |
| 72o | 100.00% | 100.00% | 0.00% | 0.00% | 0.00% |
| 62o | 100.00% | 100.00% | 0.00% | 0.00% | 0.00% |
| 52o | 100.00% | 100.00% | 0.00% | 0.00% | 0.00% |
| 42o | 100.00% | 100.00% | 0.00% | 0.00% | 0.00% |
| 32o | 100.00% | 100.00% | 0.00% | 0.00% | 0.00% |
| 22 | 100.00% | 0.00% | 100.00% | 0.00% | 0.00% |
Look at what the opponents actually call
Our separate simulations put J♠ T♠ at about 40.23% equity against AKo and 40.24% against AQo. Those are offsuit hand classes, with suit combinations weighted equally. They are a reasonable starting intuition, but neither represents the whole calling range.
In the main 40bb example, CO calls the shove with AA–88 almost throughout, AK, AQ, AJs and KQs, plus mixtures of several other hands. Here is the complete response, retaining the opening weights. In the counts below, a combination played half the time counts as half a combination. We call the resulting total its weighted range mass.
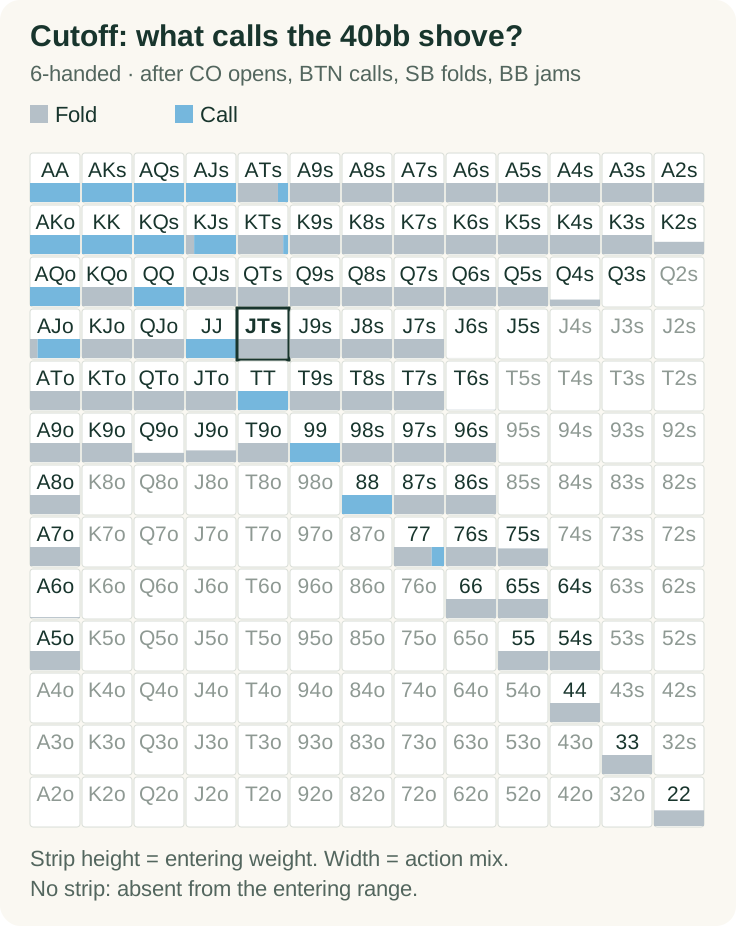
Exact range values and downloadable figure data
Entering weight is the frequency with which this hand follows its player’s earlier action. Action percentages are conditional on reaching this decision. Hands with zero entering weight are omitted here and have no strip in the figure.
| Hand | Entering weight | Fold | Call |
|---|---|---|---|
| AA | 100.00% | 0.00% | 100.00% |
| AKs | 100.00% | 0.00% | 100.00% |
| AQs | 100.00% | 0.00% | 100.00% |
| AJs | 100.00% | 0.00% | 100.00% |
| ATs | 100.00% | 79.92% | 20.08% |
| A9s | 100.00% | 100.00% | 0.00% |
| A8s | 100.00% | 100.00% | 0.00% |
| A7s | 100.00% | 100.00% | 0.00% |
| A6s | 100.00% | 100.00% | 0.00% |
| A5s | 100.00% | 100.00% | 0.00% |
| A4s | 100.00% | 100.00% | 0.00% |
| A3s | 100.00% | 100.00% | 0.00% |
| A2s | 100.00% | 100.00% | 0.00% |
| AKo | 99.96% | 0.00% | 100.00% |
| KK | 100.00% | 0.00% | 100.00% |
| KQs | 100.00% | 0.02% | 99.98% |
| KJs | 100.00% | 16.27% | 83.73% |
| KTs | 100.00% | 90.41% | 9.59% |
| K9s | 100.00% | 100.00% | 0.00% |
| K8s | 100.00% | 100.00% | 0.00% |
| K7s | 100.00% | 100.00% | 0.00% |
| K6s | 100.00% | 100.00% | 0.00% |
| K5s | 100.00% | 100.00% | 0.00% |
| K4s | 100.00% | 100.00% | 0.00% |
| K3s | 99.99% | 100.00% | 0.00% |
| K2s | 64.09% | 100.00% | 0.00% |
| AQo | 100.00% | 0.00% | 100.00% |
| KQo | 100.00% | 100.00% | 0.00% |
| 99.99% | 0.00% | 100.00% | |
| QJs | 100.00% | 100.00% | 0.00% |
| QTs | 100.00% | 100.00% | 0.00% |
| Q9s | 100.00% | 100.00% | 0.00% |
| Q8s | 100.00% | 100.00% | 0.00% |
| Q7s | 100.00% | 100.00% | 0.00% |
| Q6s | 100.00% | 100.00% | 0.00% |
| Q5s | 100.00% | 100.00% | 0.00% |
| Q4s | 33.86% | 100.00% | 0.00% |
| Q3s | 0.01% | 100.00% | 0.00% |
| AJo | 100.00% | 15.24% | 84.76% |
| KJo | 100.00% | 100.00% | 0.00% |
| QJo | 100.00% | 100.00% | 0.00% |
| JJ | 99.96% | 0.00% | 100.00% |
| JTs | 100.00% | 100.00% | 0.00% |
| J9s | 100.00% | 100.00% | 0.00% |
| J8s | 100.00% | 100.00% | 0.00% |
| J7s | 100.00% | 100.00% | 0.00% |
| J6s | 0.25% | 100.00% | 0.00% |
| J5s | 0.01% | 100.00% | 0.00% |
| ATo | 100.00% | 100.00% | 0.00% |
| KTo | 100.00% | 100.00% | 0.00% |
| QTo | 100.00% | 100.00% | 0.00% |
| JTo | 100.00% | 100.00% | 0.00% |
| TT | 100.00% | 0.00% | 100.00% |
| T9s | 100.00% | 100.00% | 0.00% |
| T8s | 100.00% | 100.00% | 0.00% |
| T7s | 100.00% | 100.00% | 0.00% |
| T6s | 1.25% | 100.00% | 0.00% |
| A9o | 100.00% | 100.00% | 0.00% |
| K9o | 100.00% | 100.00% | 0.00% |
| Q9o | 48.09% | 100.00% | 0.00% |
| J9o | 61.19% | 100.00% | 0.00% |
| T9o | 100.00% | 100.00% | 0.00% |
| 99 | 100.00% | 0.00% | 100.00% |
| 98s | 100.00% | 100.00% | 0.00% |
| 97s | 100.00% | 100.00% | 0.00% |
| 96s | 99.99% | 100.00% | 0.00% |
| A8o | 100.00% | 100.00% | 0.00% |
| 88 | 100.00% | 0.00% | 100.00% |
| 87s | 100.00% | 100.00% | 0.00% |
| 86s | 100.00% | 100.00% | 0.00% |
| A7o | 100.00% | 100.00% | 0.00% |
| 77 | 100.00% | 75.45% | 24.55% |
| 76s | 100.00% | 100.00% | 0.00% |
| 75s | 92.66% | 100.00% | 0.00% |
| A6o | 4.66% | 100.00% | 0.00% |
| 66 | 100.00% | 99.89% | 0.11% |
| 65s | 100.00% | 100.00% | 0.00% |
| 64s | 0.04% | 100.00% | 0.00% |
| A5o | 100.00% | 100.00% | 0.00% |
| 55 | 100.00% | 100.00% | 0.00% |
| 54s | 100.00% | 100.00% | 0.00% |
| 44 | 100.00% | 100.00% | 0.00% |
| 33 | 100.00% | 100.00% | 0.00% |
| 22 | 82.51% | 100.00% | 0.00% |
The button’s response depends on what CO does first. With the same initial flatting range, BTN calls with 22.17% of its displayed range after CO folds, but only 4.19% after CO calls. Those shares are calculated before removing J♠ T♠.
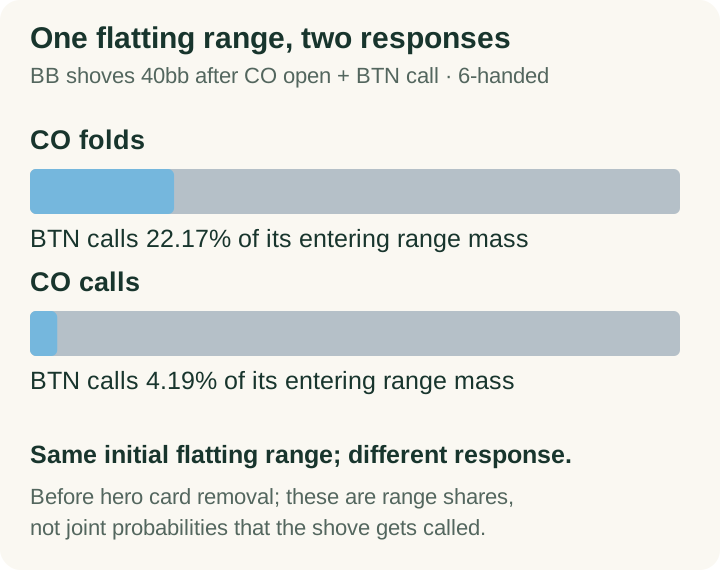
| BTN hand | Initial flatting weight | Calls after CO folds | Calls after CO calls |
|---|---|---|---|
| 88 | 84.50% | 100.00% | 0.02% |
| 99 | 82.27% | 100.00% | 100.00% |
| AQs | 99.73% | 100.00% | 99.56% |
| AQo | 85.41% | 100.00% | 0.00% |
| AJs | 99.99% | 100.00% | 0.01% |
| KQs | 100.00% | 99.92% | 0.02% |
For example, 88 calls the shove after CO folds, but folds 99.98% after CO calls. AQs and 99 survive both branches at high frequency in this particular export. These are conditional decisions for hands already in BTN’s flatting range, not instructions to cold-call those hands in every game.
The distinction is also central to Brokos’s analysis of responses to BB squeezes. Do not multiply two displayed fold percentages and call the answer “our fold equity”: the responses are sequential, and the players’ cards must be compatible.
How much equity does JTs keep?
We separately simulated J♠ T♠ against these full calling ranges, including a three-way case using both opponents’ calling ranges. All cards were physically compatible, ties were split, and each estimate used 200,000 deals.
| J♠ T♠ against… | Showdown equity | 95% simulation interval |
|---|---|---|
| CO calling range alone | 35.09% | 34.88–35.30% |
| BTN calling range after CO folds, alone | 41.04% | 40.83–41.26% |
| Both calling ranges, product model | 27.13% | 26.94–27.32% |
These are calculated showdown equities, not stored solver equities. The calculations use marginal range weights. They do not recover the full conditioning from other players’ folds, so they diagnose the matchups rather than reconstruct the shove EV. The intervals cover random simulation error only.
Against CO’s calling range alone, JTs retains about 35% equity. It is still behind. The attraction of the shove must include the pots won without a showdown and the value of its alternatives. “It does fine against AK” cannot establish that shoving beats calling.
Does 65s actually appear among the folds?
It does: both CO and BTN have all four 65s combinations in their entering ranges here, and 65s folds to the shove. J♠ T♠ removes none of them. That verifies the card-removal idea, but does not measure how much 65s contributes to the shove’s EV.
But J♠ T♠ removes other folds as well as calls. Here are the actual weighted combination counts for the main example.
| Range portion | Before J♠ T♠ removal | After removal | Mass removed |
|---|---|---|---|
| CO calls | 98.18 | 87.50 | 10.87% |
| CO folds | 368.12 | 330.95 | 10.10% |
| BTN calls after CO folds | 47.29 | 43.75 | 7.48% |
| BTN folds after CO folds | 166.02 | 148.06 | 10.82% |
Against CO, the cards remove a slightly larger fraction of calls than folds. Against BTN after CO folds, the balance goes the other way. J♠ T♠ removes three physical JJ combinations and three TT combinations from CO’s range, approximately six weighted combinations in total. The equity of the removed callers matters too; these counts do not establish a net EV benefit from the blockers.
This is the useful version of the blocker check: name the response range, count the hands removed, and check both sides. Leaving one weak suited connector available is only one piece of it.
The exception: early ranges at 40bb
Stay at eight-handed tables and 40bb. Against CO’s open and BTN’s call, the BB shoves JTs 99.99%. Move the open and call to UTG and UTG+1, with everyone between the caller and BB folding, and JTs calls 100%.
| Action | Frequency | EV (bb) |
|---|---|---|
| Fold | 0.00% | +0.000 |
| Call | 100.00% | +0.541 |
| Raise to 10.7bb | 0.00% | +0.329 |
| Shove to 40bb | 0.00% | -0.208 |
The shove loses 0.749bb relative to calling. Folding is also worse than calling here. The lesson is to keep the call available, not to throw away JTs because the opener is early.
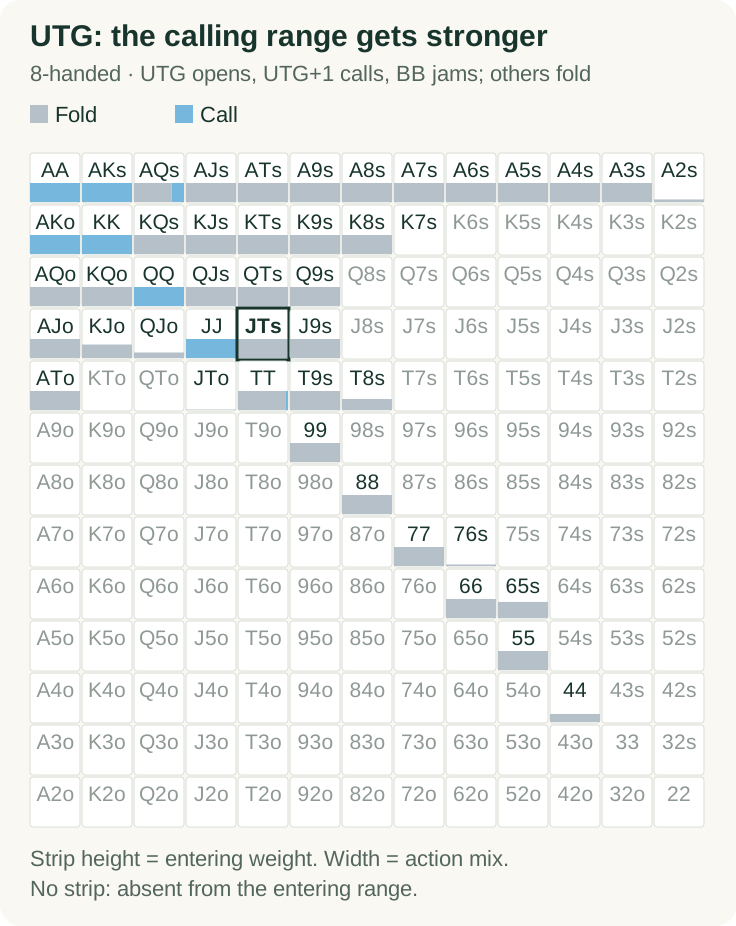
Exact range values and downloadable figure data
Entering weight is the frequency with which this hand follows its player’s earlier action. Action percentages are conditional on reaching this decision. Hands with zero entering weight are omitted here and have no strip in the figure.
| Hand | Entering weight | Fold | Call |
|---|---|---|---|
| AA | 100.00% | 0.00% | 100.00% |
| AKs | 100.00% | 0.01% | 99.99% |
| AQs | 100.00% | 75.34% | 24.66% |
| AJs | 100.00% | 99.99% | 0.01% |
| ATs | 100.00% | 100.00% | 0.00% |
| A9s | 100.00% | 100.00% | 0.00% |
| A8s | 100.00% | 100.00% | 0.00% |
| A7s | 100.00% | 100.00% | 0.00% |
| A6s | 100.00% | 100.00% | 0.00% |
| A5s | 100.00% | 99.99% | 0.01% |
| A4s | 100.00% | 100.00% | 0.00% |
| A3s | 100.00% | 100.00% | 0.00% |
| A2s | 13.48% | 99.99% | 0.01% |
| AKo | 99.99% | 0.00% | 100.00% |
| KK | 99.99% | 0.00% | 100.00% |
| KQs | 100.00% | 99.98% | 0.02% |
| KJs | 100.00% | 100.00% | 0.00% |
| KTs | 100.00% | 100.00% | 0.00% |
| K9s | 100.00% | 100.00% | 0.00% |
| K8s | 100.00% | 100.00% | 0.00% |
| K7s | 0.01% | 100.00% | 0.00% |
| AQo | 100.00% | 99.90% | 0.10% |
| KQo | 100.00% | 100.00% | 0.00% |
| 99.98% | 0.00% | 100.00% | |
| QJs | 100.00% | 100.00% | 0.00% |
| QTs | 100.00% | 100.00% | 0.00% |
| Q9s | 100.00% | 100.00% | 0.00% |
| AJo | 100.00% | 100.00% | 0.00% |
| KJo | 70.91% | 100.00% | 0.00% |
| QJo | 28.98% | 100.00% | 0.00% |
| JJ | 100.00% | 0.01% | 99.99% |
| JTs | 100.00% | 100.00% | 0.00% |
| J9s | 100.00% | 100.00% | 0.00% |
| ATo | 100.00% | 100.00% | 0.00% |
| JTo | 2.69% | 100.00% | 0.00% |
| TT | 100.00% | 95.76% | 4.24% |
| T9s | 100.00% | 100.00% | 0.00% |
| T8s | 57.76% | 100.00% | 0.00% |
| 99 | 100.00% | 99.99% | 0.01% |
| 88 | 100.00% | 100.00% | 0.00% |
| 77 | 100.00% | 100.00% | 0.00% |
| 76s | 8.00% | 100.00% | 0.00% |
| 66 | 100.00% | 100.00% | 0.00% |
| 65s | 84.61% | 100.00% | 0.00% |
| 55 | 100.00% | 99.99% | 0.01% |
| 44 | 42.30% | 100.00% | 0.00% |
AA, KK, QQ and AK together make up 82.4% of this UTG calling range’s weighted mass, versus 34.6% of CO’s calling mass in the main six-handed example, before hero card removal. Our diagnostic calculation gives J♠ T♠ about 28.45% against the UTG calling range alone, compared with 35.09% against CO’s.
That is evidence consistent with a less attractive all-in matchup. It is not a proof that this composition change alone causes the EV reversal.
The boundary gets more expensive at 50bb: in the eight-handed UTG→UTG+1 formation, shoving JTs loses 1.936bb from BB and 2.146bb from SB, relative to the best reported alternative.
A rule worth taking into study
At 30–40bb in these chip-EV models, put JTs on your squeeze-jam shortlist after HJ→CO or CO→BTN. Recheck early-position open-and-call ranges, and compare the shove with calling before adopting it.
Keep the tournament model attached to the rule. We did not test payout pressure, bounties, unequal stacks, different antes, or opponents who call too widely. GTO Wizard’s comparison of squeeze ranges across tournament and cash models is a useful reason to treat those as new questions, rather than carrying this chip-EV chart into them unchanged.
For a study exercise, pick the same late-position formation at 30bb and 40bb. Predict JTs’s action, then check QJs and A5s. Write down both frequencies and the EV difference from calling. Finally, move the open and call earlier and see which part of your explanation survives.
GTO Preflop is our app. Its Multiway range-viewer guide shows how to rebuild an open-plus-call sequence. Use the app to compare the available tournament configurations, checking the settings and data version. This study uses a separate export of our owned solve database. Available app configurations and their results may differ; use the article’s downloadable tables for this study’s exact results.
If you are studying first-in decisions, use the MTT stack-size guide instead. Open-jamming and squeeze-jamming answer different questions.
How we checked the numbers
We used ten current preflop solve trees: two table sizes and five equal-stack depths. The 60-case matrix was fixed after exploring the two six-handed 40bb CO→BTN blind decisions. The no-caller comparison was added afterward and is exploratory.
The source is an HRC-derived stored database. We independently checked the action paths, hand order, frequency decoding, EV scale and every JTs row. The export does not identify achieved convergence or the exact postflop abstraction. Small EV differences and residual mixes should therefore be read as estimates, not precise indifference certificates. HRC’s description of its postflop modeling explains why those model details matter, but does not document these particular files.
Range weighting, simulation settings and coverage
A range’s weighted combination mass is the sum of entering weight × available combinations × action frequency. Before card removal, pairs have six combinations, suited hands four, and offsuit hands twelve. For the blocker table we expanded each class, removed combinations containing J♠ or T♠, and recomputed the mass. This does not recover joint probabilities after every player’s action.
For equity, each opponent combination was weighted by its entering weight times its call frequency. Hero’s cards were removed. In the three-way calculation, both opponents were sampled together; if their cards overlapped, both were redrawn. Five board cards were drawn uniformly from the remaining deck, and ties shared the pot. This product-of-marginal-ranges model omits the additional conditioning from folded players’ cards and their action history.
Each equity case used 200,000 accepted deals, Python 3.11 and eval7 0.1.11. Seeds 2026090701–2026090703 generated the three main-example rows; 2026090704–2026090706 generated the early-position counterparts. The 95% simulation interval is mean equity ± 1.96 sample standard errors. It measures Monte Carlo noise only. A fixed AA-versus-AA symmetry check returned 50.01% against its known 50% expectation.
The local cost of shoving is max(action EV) − shove EV at one node. It does not evaluate a changed strategy throughout the tree. Open sizes in the selected trees are 2bb at 20bb, 2.1bb at 25/30bb, and 2.3bb at 40/50bb. Non-all-in squeeze sizes also vary; the complete action menu for each headline example is shown above. All 60 planned cases were available and analyzed. No cash, ICM, bounty, unequal-stack or 35bb result was inferred from them.
The broad shortcut “shove JTs in every tested squeeze spot” selects the highest reported EV in 35 of 60 cases. It is within 0.05bb in 46 cases; nine cases lose at least 0.10bb. Those thresholds were chosen before the full grid as study screens, not universal definitions of a blunder. The worst loss is 2.146bb.
These are descriptive counts over selected configurations, equally weighted. They are not independent random samples, confidence intervals for poker strategy, or a measured win rate. There was no 35bb solve in the selected set, and we did not interpolate one.
Download the 60-case frequency and EV table. The range figures also have exact values in their expandable tables above. All displayed study results were retrieved or calculated on September 7, 2026.