The short answer
Memorize which actions are live in a spot and the shape of the range around them. Don’t memorize mixing frequencies, and don’t sweat the exact bottom hand. We measured every solved decision in GTO Preflop’s on-device library, 11,385 spots and 1,924,065 hand strategies, then priced both kinds of mistake in big blinds. Picking the wrong side of a mixed strategy costs a median of 0.018 BB. Taking an action the solver never takes in that spot costs a median of 0.325 BB, about eighteen times more. And the bottom quarter of a 100BB under-the-gun opening range is worth 0.15% of that range’s total value.
Note:
Full disclosure: GTO Preflop is our app, and the numbers below come from the solve files it ships. Everything here is reproducible: the method, the definitions and the validation check are in the next section, and the raw data is on your phone if you have the app installed.
How we measured it
The app ships 503 Brotli-compressed solution files covering cash, MTT and Spin & Go. Between them they hold 11,385 decision points and 1,924,065 hand strategies. Each strategy records three things for one starting hand at one node: the weight with which that hand arrives there, the frequency the solver assigns to each legal action, and the expected value of each action in big blinds, with folding fixed at zero.
We walked all 503 files and kept the 1,396,979 decisions where the hand actually reaches the node with non-zero weight. A hand you never hold in a spot isn’t something you can get wrong there. Then three labels:
- Pure fold — the solver folds at 99% or higher. Nothing to learn beyond “not this one.”
- Pure action — some non-fold action at 99% or higher. One thing to learn.
- Mixed — nothing reaches 99%. The solver splits.
Before trusting any of it we reproduced a figure the app already prints on its own store screenshots: at 8-max, 100BB, 5% rake with a 4BB cap, our walk gives a 13.9% first-in opening range under the gun and 43.7% on the button. Those match. The rest of the numbers come from the same traversal.
Two caveats worth stating up front. The library is not evenly distributed across formats. 435 of the 503 files are Spin & Go, which is why 66% of the live decisions come from three-handed short-stack play. Every aggregate below is broken out by format further down. And the 99% cutoff is a choice: loosening it to 95% moves the mixed share from 24.3% to 17.9%, so the direction of every finding survives, but the exact percentages move.
Two-fifths of the chart is not a decision at all
Here’s the split across all 1,396,979 live decisions.
| What the solver does | Decisions | Share |
|---|---|---|
| Folds, 99%+ | 565,549 | 40.5% |
| Takes one non-fold action, 99%+ | 492,179 | 35.2% |
| Mixes between two or more actions | 339,251 | 24.3% |
Two-fifths of everything is a pure fold. That’s the mass of the chart that requires no memory at all, and it’s concentrated in the same corner every time: 29 hands are pure folds in 70% or more of the spots they reach, all of them offsuit and all of them in the bottom-left triangle. 62o is a pure fold 79.2% of the time. 80 of the 169 starting hands are pure folds in at least half their spots.
At the other end, exactly three hands are never a pure fold in any spot they reach: AA, KK and AKs. QQ misses the list by four spots out of 10,490, AKo by six out of 9,163.
Strip out the pure folds and 831,430 decisions are left, the ones where you’re putting money in at least some of the time. Of those, 59.2% are pure and 40.8% are mixed. Restrict to first-in spots, which is what most people mean by “preflop ranges,” and the picture is friendlier still: two-thirds of the decisions where you open by position are a single action with no mixing at all.
What it costs to pick the wrong side of a mix
Take a concrete one. Six-handed, 100 big blinds, 5% rake capped at 4BB, folded to the button, J3s. The solver folds it 56.2% of the time and opens to 2.5BB the other 43.8%. The EV of folding is 0. The EV of opening is −0.00002 BB.
That is the whole disagreement. Two hundred-thousandths of a big blind.
J3s isn’t a special case, it’s the shape of the thing. On that same button node, T8o is 51.3% fold and 48.7% raise; from under the gun, 55 is 34.7% fold and 65.3% raise; QJo is 49.2/50.8. A mixed strategy exists because the solver found two actions worth the same, and “worth the same” is not a figure of speech — it’s why it’s mixing.
So what if you ignore all of it? Collapse every mixed strategy in the database down to whichever action the solver takes more often, the way any printable chart does, and the cost is:
| Cost of always playing the most-frequent action | Share of mixed decisions |
|---|---|
| 0.01 BB or less | 68.3% |
| 0.05 BB or less | 86.6% |
| 0.10 BB or less | 90.9% |
| Median cost | 0.0032 BB |
Two numbers in this post describe that mistake and they are not the same quantity. The 0.0032 BB median above is over all 339,251 mixed decisions, and it includes every time hard-rounding happens to land on the action you would have picked anyway, which costs nothing. The 0.018 BB in the opening — and in the comparison below — is the median when you always take the losing side, over the narrower set of decisions where the solver also has an action it never takes.
Averaged over all 1,396,979 live decisions, hard-rounding every mix in the entire library costs 1.5 big blinds per 100 preflop decisions. Not per 100 hands. Per 100 times you’re actually facing a solved spot with a hand in your range, which is a much rarer event.
If you’re currently trying to run a randomizer at the table to hit 43.8% on J3s, stop. Pick a side and move on.
Tip:
Check your own worst offender: open GTO Preflop, find the spot you keep second-guessing, and tap the hand. The app labels it as a single-action hand or a mixed one and prints the EV of each option, so you can see for yourself whether the thing you’re agonising over is worth a hundredth of a big blind.
The mistake that actually costs money
Now the other error. Not picking the wrong side of a mix, but taking an action the solver assigns zero frequency to.
Same button node, same J3s. Folding and opening to 2.5BB are within 0.00002 BB of each other. Shoving 100 big blinds costs 3.75 BB. That’s the gap between a decision that doesn’t matter and one that does, sitting inside one hand in one spot.
To price this properly we isolated the 265,312 decisions where both error types are available, meaning the solver mixes and at least one legal action gets zero frequency, then measured them against each other.
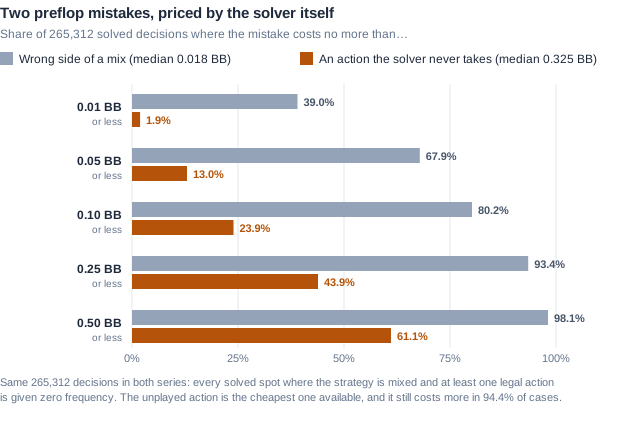
Median cost of the wrong side of the mix: 0.018 BB. Median cost of the cheapest action the solver won’t touch: 0.325 BB. Not the worst such action — the cheapest one available. In 94.4% of these decisions, the off-strategy action costs more than the mixing error does.
Almost two in five wrong-side errors, in that narrower set, cost a hundredth of a big blind or less. Fewer than one in fifty off-strategy actions are that cheap.
This is the whole argument for what to study. The frequencies are noise. The action set is the signal. Knowing that a spot is a fold-or-open node and not a fold-or-open-or-jam node is worth more than knowing that the open runs at 43.8%.
The bottom of your opening range is nearly worthless
The standard advice for memorizing a range is to learn its bottom hand, the boundary, and infer everything above it. As a filing system that’s fine. As a study priority it’s backwards, and the EV numbers say so bluntly.
Six-handed, 100BB, under the gun. The solver opens 18.7% of hands, which is 247 combos, and the total value of that opening range over folding everything is 101.4 big blinds. Sorted by EV:
| Slice of the opening range | Share of the range’s total EV | Hand at the boundary |
|---|---|---|
| Top 10% of combos | 81.7% | AKo, worth 0.566 BB |
| Top 25% | 90.9% | AQo, worth 0.178 BB |
| Top 50% | 96.9% | AJo, worth 0.070 BB |
| Top 75% | 99.85% | K5s, worth 0.010 BB |
| Top 90% | >99.9% | K6s, worth 0.0003 BB |
The bottom quarter of the range, the part everyone drills, contributes about a sixth of one percent of the range’s value. K6s open-raised under the gun is worth three ten-thousandths of a big blind more than folding it.
The button is less extreme because it opens 44.9% of hands and the value is spread over 596 combos, but the shape holds: the top 10% carry 65.8% of the EV and the bottom 25% carry 1.5%. Across all 1,146 first-in spots in the library, the top 10% of combos hold a median of 36.7% of the range’s total value.
Across every opening range in the database, 11.1% of the combos the solver opens are worth 0.05 BB or less. They’re in the range because they’re not quite a fold. Getting them wrong is not what’s costing you money.
Which hands actually need judgment
If mixing is where the solver hesitates, it’s worth knowing where it hesitates most. We scored all 169 starting hands by the share of their live decisions that come back mixed.
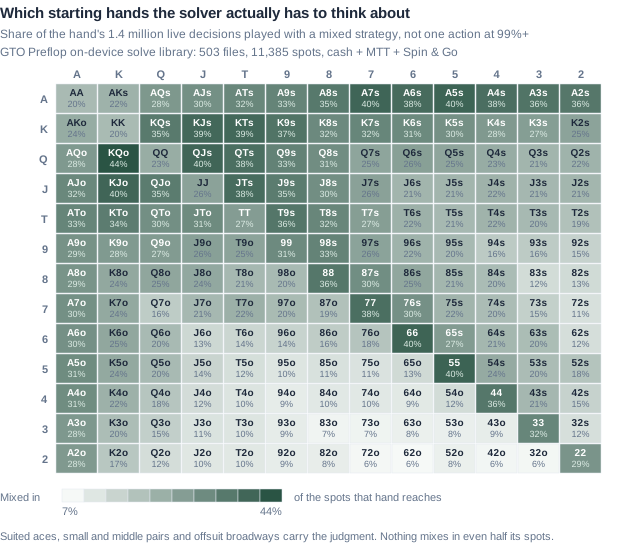
The hot band is a diagonal shoulder: suited aces (A2s through A8s all between 35% and 41%), small and middle pairs (55 at 40.4%, 66 at 40.1%, 77 at 37.7%), suited broadways (QJs, KJs, KTs all around 39%) and the offsuit broadways at the top-left (KQo at 43.8%, KJo at 39.8%). Nineteen hands are pure in 90% or more of their spots, and every one of them is offsuit trash.
Two things in that grid surprised us.
Nothing mixes in even half its spots. KQo tops the list at 43.8%. The mental model of GTO as a fog of randomisation doesn’t survive contact with the file: most of the time, in most spots, for most hands, the solver picks one action and sticks to it.
AA mixes in 20.1% of its decisions, and not once between playing and folding. Aces are a pure fold in exactly zero of the 10,787 spots they reach. What they’re mixing is sizing: raise small or raise big, call the 4-bet or jam. That’s a general property of this metric. A mixed cell in that grid means the solver split its frequency somewhere, which at the top of the chart is nearly always a sizing decision and at the bottom is nearly always play-or-fold.
The load is also spread rather than concentrated. The 50 most-mixed hands account for 48.9% of all mixed decisions, against the 29.6% a flat distribution would give. There’s no shortlist of twelve tricky hands to learn.
Cash, MTT and Spin & Go don’t ask the same thing of you
Aggregates hide a real split. Deep cash is by far the most demanding format in the library, and short-stack tournament play is the most forgiving.
| Format | Live decisions | Pure fold | Pure, of the decisions where you play | Mixed | Median cost of an off-strategy action |
|---|---|---|---|---|---|
| Cash, 50–200BB | 96,241 | 61.8% | 37.2% | 62.8% | 1.06 BB |
| MTT, 3–100BB | 383,223 | 52.6% | 59.2% | 40.8% | 0.48 BB |
| Spin & Go, 1.5–34BB | 917,515 | 33.2% | 60.5% | 39.5% | 0.30 BB |
Deep-stacked cash mixes in 62.8% of the spots where you play rather than fold, against roughly 40% in both tournament formats. It also punishes an off-strategy action more than three times harder than a Spin & Go spot does. Two reasons: more chips behind means more actions and sizings to split between, and a pot with 100 big blinds available to lose simply has more room in it than one with 12.
Practical read: if you play short-stack tournaments, your ranges are genuinely memorizable and a printed chart captures most of your strategy. If you play deep cash, accept that a chart will never capture your strategy and spend the time on which actions belong in each node instead.
What to memorize, in order
- The action set for each node. Fold-or-open, fold-call-or-3bet, fold-call-3bet-or-jam. This is the thing that costs 0.325 BB a pop when you get it wrong, and it’s the cheapest thing on this list to learn, because there are only a handful of shapes.
- The top of every range, cold. The 10% of combos carrying 66–82% of a 100BB cash opening range’s value. No mixing, no ambiguity, enormous EV.
- The shape of the middle. Suited aces, pairs, suited broadways, roughly where they sit. Not their frequencies.
- The boundary, last and loosely. Learn it as an index so you can reconstruct the range. Don’t drill it, and don’t beat yourself up for missing K6s under the gun by one row.
- Nothing about frequencies. Pick the more-frequent side of every mix and you’re giving up 1.5 BB per 100 preflop decisions, which is inside the noise of one session.
The one thing this list can’t tell you is which of these you’re personally getting wrong. That takes measurement, not a chart: the same EV-loss review loop that works postflop.
How GTO Preflop scores this
The reason we could run this study is the reason the app is built the way it is: the strategy and the EV of every action ship together, so the app can grade a decision by what it cost rather than by whether it matched.
Tap any hand in the range viewer and it tells you whether the hand is best played with a single action or benefits from a mixed strategy, then prints the frequency and EV of each option. The Trainer deals spots, grades your action against the solution, and reports the result as EV Loss in big blinds with an ELO rating attached. That scoring is the point. An accuracy percentage would mark you wrong for folding J3s on the button; an EV-loss score charges you essentially nothing for that and 3.75 BB for shoving, which is the correct relative weight.
Two honest limits. The Trainer covers MTT spots at 3–12BB and cash at 50–200BB, not the whole library, so the deep-cash mixing you just read about is drillable but the 15–100BB MTT range is view-only. And the multiway solves load from the cloud rather than the device, so that part needs a connection.
GTO Preflop is free to download on iPhone, iPad and Android. The standard Pro plan is $19.99 a month or $119.99 a year; we run pricing experiments, so the price you see may differ. It holds 4.8 stars from 240 US App Store ratings and 4.6 from 3.2K Google Play reviews on 100K+ downloads as of August 24, 2026. Get the app and check any number on this page against the range viewer.
Frequently asked questions
How long does it take to memorize preflop ranges?
Less time than the usual advice implies, because most of the chart isn’t a decision. Two-fifths of all solved decisions are pure folds and another third are a single non-fold action, so around three-quarters of what a chart shows you is one fact per cell. The genuinely ambiguous part is the mixed band of suited aces, small pairs and broadways, and getting one of those wrong costs a median of 0.018 BB.
Do I need to memorize mixed frequencies?
No. Across 339,251 mixed decisions, playing the most-frequent action every time instead of randomising costs 0.01 BB or less in 68.3% of cases and 1.5 BB per 100 preflop decisions overall. Randomising at the table buys you balance against opponents who are tracking your frequencies, which almost nobody below high stakes is doing.
What’s the most expensive preflop mistake?
Taking an action the solver gives zero frequency to. Measured over the 265,312 decisions where both errors are possible, the cheapest zero-frequency action costs a median of 0.325 BB against 0.018 BB for picking the wrong side of a mix, and it’s the more expensive error in 94.4% of them. In practice that means cold-calling in a node the solver only folds or 3-bets, or picking a size that isn’t in the tree.
Should I memorize the bottom hand of each range?
As a memory aid, yes: it lets you reconstruct the range. As a study priority, no. In a six-handed 100BB UTG opening range, the bottom 25% of combos hold 0.15% of the range’s total value, and the hand at that boundary is worth 0.010 BB over folding.
Are preflop ranges the same for cash and tournaments?
No, and they differ in how hard they are to learn as well as in content. The starkest content gap is big blind defense, which roughly doubles from raked cash to ante MTTs against the same button open. Deep cash mixes in 62.8% of the decisions where you’re playing, against 39–41% in MTT and Spin & Go, and it punishes an off-strategy action about 3.5 times harder. The best preflop chart apps split their coverage by format for this reason.
Does this apply to multiway pots?
The library measured here is heads-up-by-the-time-it-reaches-you: 1,146 first-in spots and 10,239 facing exactly one opponent. Multiway preflop ranges sit in a separate solve tree and aren’t part of these numbers.
Sources
- GTO Preflop’s on-device solve library — 503 Brotli-compressed solution files, 11,385 decision points, 1,924,065 hand strategies, read directly and traversed on August 24, 2026. Coverage figures cross-checked against the app’s
gto_preflop_database_coverage.md - Method validation — first-in opening frequencies reproduced from the same traversal (8-max, 100BB, 5% rake / 4BB cap: 13.9% UTG, 43.7% button) and matched against the figures printed on GTO Preflop’s own App Store screenshots
- GTO Preflop on the App Store — version 3.0.30, free download, 4.8/5 from 240 ratings, checked August 24, 2026
- GTO Preflop on Google Play — 4.6/5 from 3.2K reviews, 100K+ downloads, checked August 24, 2026
- PokerCoaching: how to study preflop ranges — the widely repeated “learn the bottom two hands of each range” approach this post tests against EV data
- MyPokerCoaching: how to learn and remember preflop ranges — range-components and active-recall study methods
Every figure on this page was computed from GTO Preflop’s shipped solve files on August 24, 2026 and is reproducible from the app. EVs are in big blinds with folding fixed at zero. Prices verified the same day; pricing experiments are live, so the plan you see may differ.